
Thank you
Visual Design
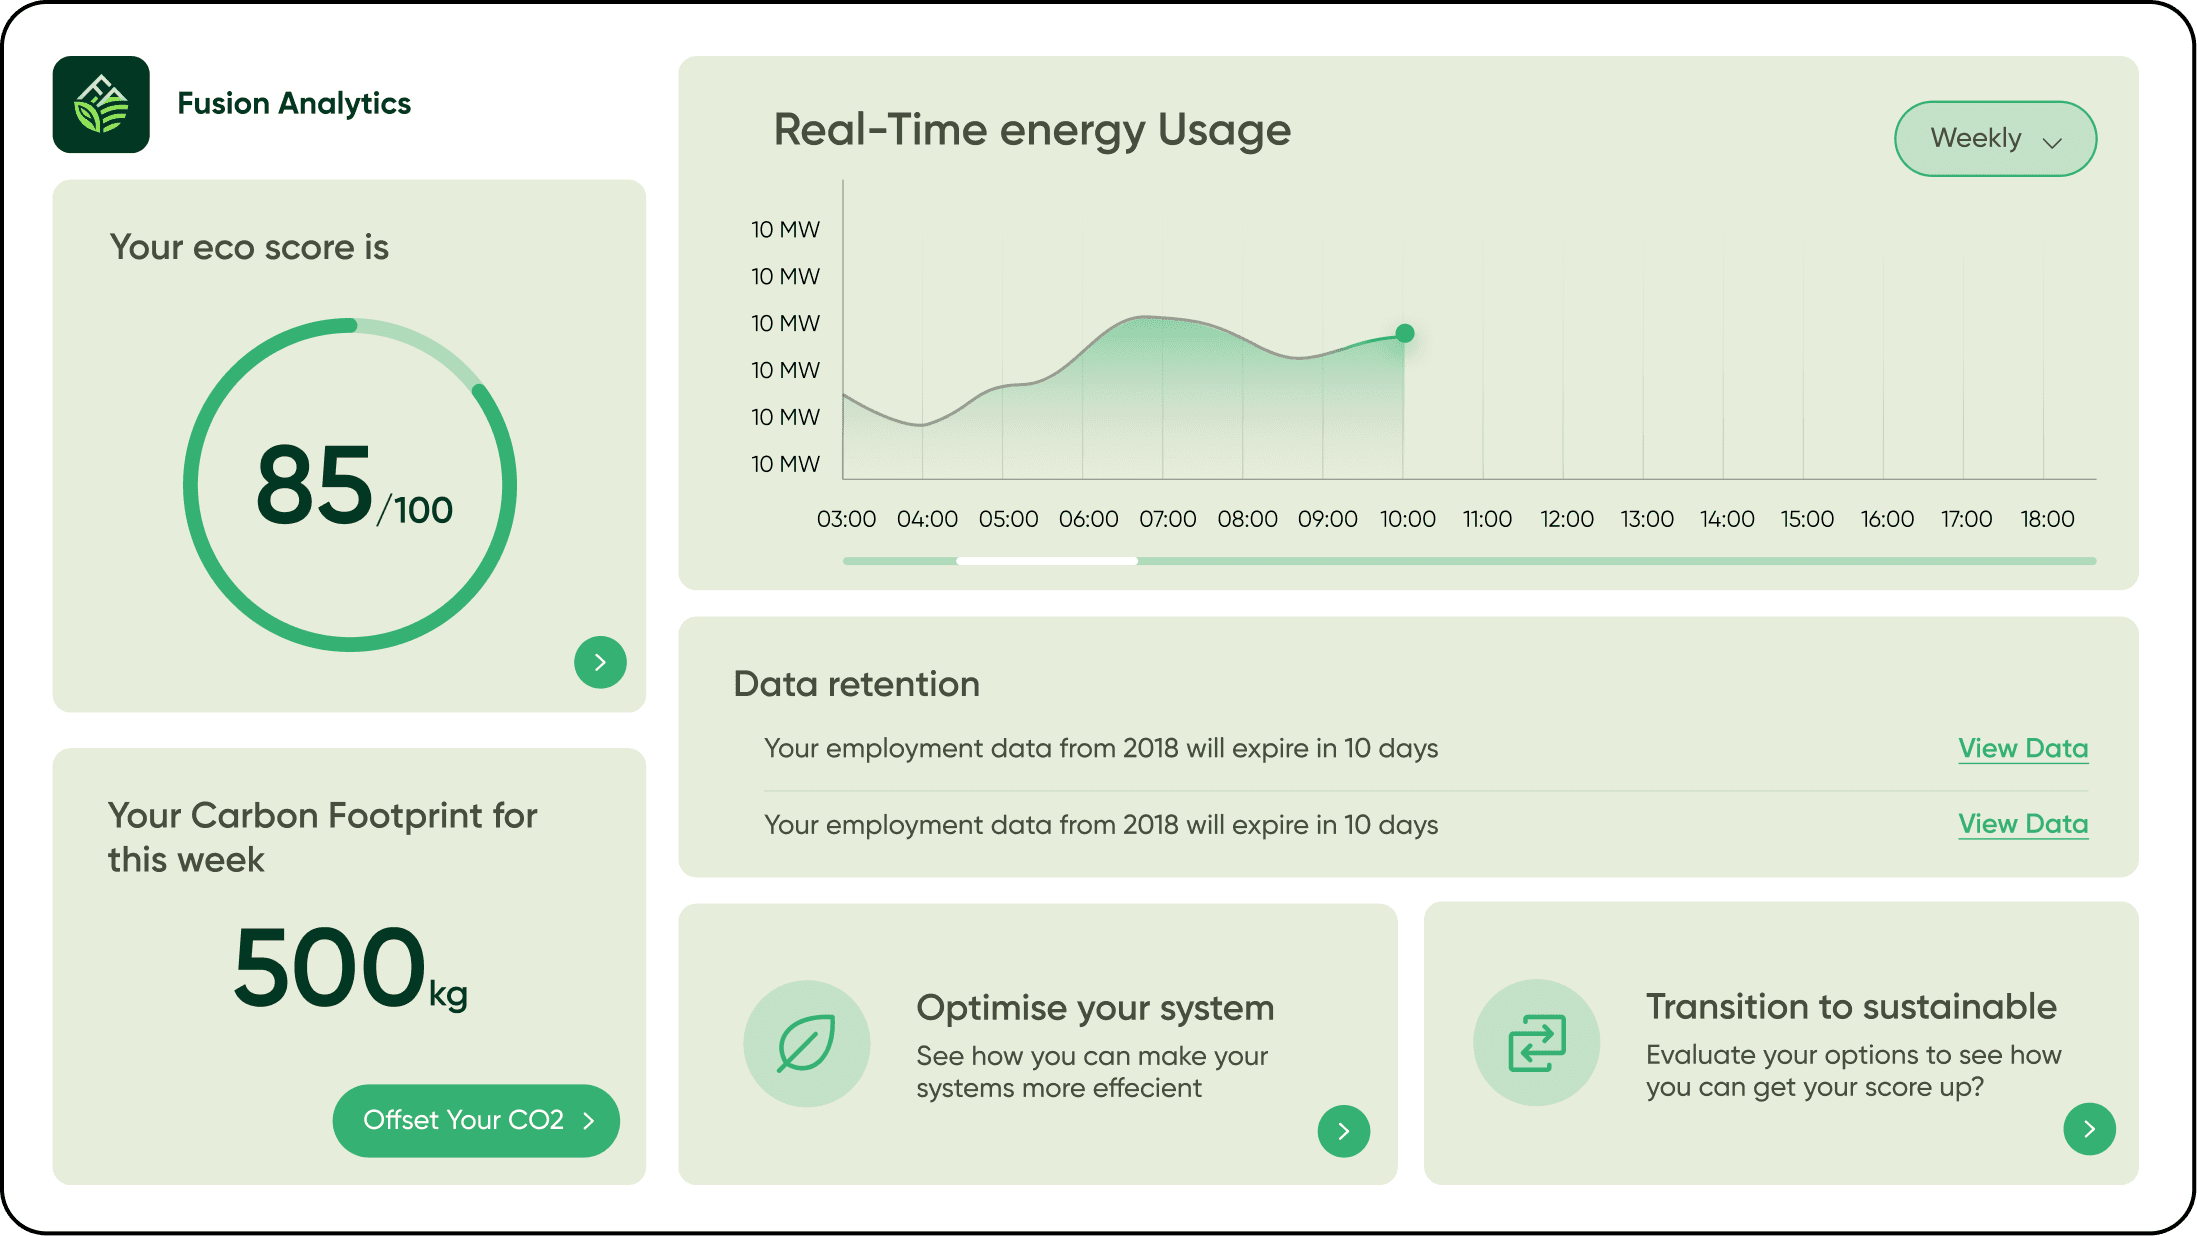
Dashboard
- Eco-score based on system efficiency
- Real-time energy usage graph
- Carbon footprint counter
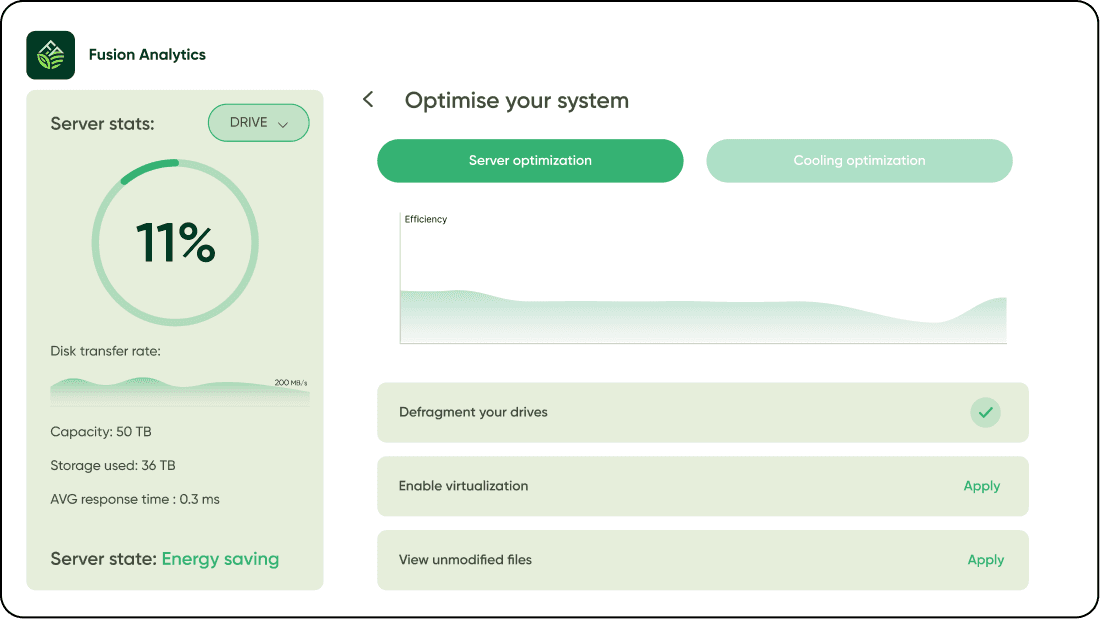
Optimise system
- Track real-time system stats
- Track efficiency
- Optimise server and the cooling
- Optimize storage (deletion of redundant/obsolete data)
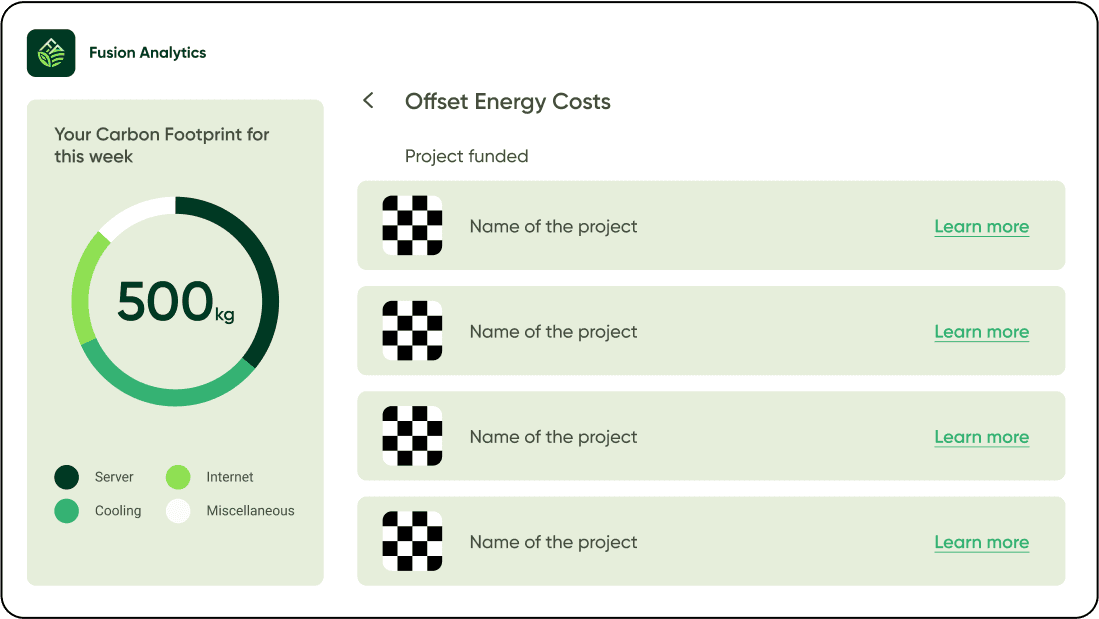
Offset carbon footprint
- See what increased the carbon footprint
- Find projects to offset
- Learn more about the projects
Information architecture
Empathy Map
Says
“I want to be sustainable but there are a lot of options in the market and i don’t know what to choose”
“Finding a solution takes a lot of time and money”
“I want to elevate the public image of my organisation”
Thinks
I want to align my company with sustainable practices
What are the financial implications of going green?
How can we reduce our digital carbon footprint?
How will eco-friendly initiatives impact our brand and reputation?
Does
Looks at data and information about the carbon footprint of the company's digital operations
Explore alternative energy source
Invest in research and developments for sustainable technologies
Feels
Overwhelmed with numerous options available to go green.
Anxious about the potential costs of implementing eco-friendly solutions
Interested in understanding the ROI (Return on Investment)
Frustrations
Balancing Profit and Sustainability
Data Collection and Analysis
Technological Obsolescence
Goals
Find a feasible solution to be sustainable in less time
Wants the right guidance to be sustainable.
Primary research
We interviewed industry experts from large companies at the event to understand how they reduce their carbon foot print. Insights:
Many companies tend to offset their energy costs rather than directly connecting to renewable energy sources.
Most companies that use renewable energy keep the power grid as a backup.
Many companies rely on a mix of renewable and non-renewable sources of energy.
Secondary research
The majority of energy used by data centers comes from non-renewable sources, such as coal and natural gas.
It's estimated that data centers currently account for around 2% of global GHG emissions - more than the entire aviation industry.
Looking at the lifecycle of a datacenter, we see that more than 85% of the carbon impact today comes from operations.
There are some exceptions, where operators take the responsibility to generate power on-site using renewables or gas, but largely speaking local grids power data centers.
Rapid improvements in energy efficiency have helped limit energy demand growth from data centers and data transmission networks, which each account for about 1-1.5% of global electricity use.


Design Process
Empathy
Define
Ideate
Prototype
Introduction
During a 24-hour hackathon at the Indian Institute of Science (IISc), we were presented with three challenging project options. Our team chose the topic of reducing the digital carbon footprint.
Goals
Help self-hosted data centers make the switch to renewable energy.
Convince data centers of the economic benefits by informing them about the ROI.
Help data centers optimise their servers to reduce server load.
My Role
I helped with the secondary research to gather essential data and insights.
Contributed to the UI design to ensure a user-friendly interface.
Created a video explaining our solution for reducing the digital carbon footprint.
Fusion
Analaytics
Redefining Digital Power for a Green Tomorrow.
User persona

Name
Sarah
34 y
Age
Entrepreneur
Occupation
Bangalore
Location
Female
Gender
MSc in ACS
Education
Sarah Mitchell, a passionate and visionary leader dedicated to making our company a beacon of sustainability and corporate responsibility. With a background in environmental science and a deep commitment to social and environmental causes, Sarah embodies the driving force behind our company's transformation into a more sustainable and ethically responsible enterprise.
Introduction
PERSONAL TRAITS
Innovative
Passionate
Community-Minded
USE OF TECHNOLOGY
Frustration
Balancing Profit and Sustainability
Data Collection and Analysis
Technological Obsolescence
Goals
Find a feasible solution to be sustainable in a short amount of time.
Wants the right guidance to be sustainable.
Design System
Primary
Secondary
Colours
Icons
Gilroy
Heading Main - Bold 32
Heading 1 - SemiBold 28
Heading 2 - SemiBold 24
Heading 3 - SemiBold 20
Heading 3 - Medium 20
Heading 5 - Semibold 16
Heading 6 - Medium 16
Body 1 - Medium 16
Body 2 - Regular 16
Body 3 - Regular 14
Body 4 - Regular 12
Typography